This post was most recently updated on December 28th, 2016
Google Analytics reports for Custom Dimension and Metrics. If you are reading this post first, I would recommend reading Google Analytics- Custom dimensions and metrics with Example first that mentions how to add the script that fetches the statistics, these reports are based on the same script.
Step1: Go to Google Analytics Customization tab, create New Custom Report
select the custom created dimensions and metrics i.e Test User Traffic and Test User traffic metric
These are the setting I have used.
Report content:
1. Report type:
a. Explorer: The standard Google Analytics report that includes a line graph and data table that includes dynamic elements like search/ sort options and secondary dimensions
b. Flat Table: A static, sortable table that displays data in rows.
c. Map Overlay: A map of world with dark regions showing traffic and engagement volume.
2. Filters: Filters lets you restrict data that appears in the report. For example to view user traffic from only admin or a specific user.
3. Views: Select to show this report to a specific view or to all views(All Web Site Data).
Save the settings.
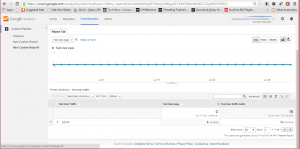
Step 2: Goto to the reports tab. you can view the user statistics.
Note: The stats are updated within 24 hours. So the stats for today would reflect tomorrow in the reports.
Userwise hits
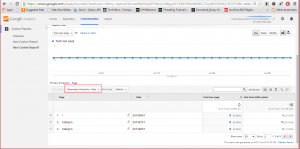
Pagewise hit by User
Step 3: You can change the Secondary Dimension option to view more reports for example:
Pagewise and datewise hit by User


