This post was most recently updated on June 17th, 2019
What is Flowchart
A pictorial representation of an algorithm is called a ‘Flowchart’. In flowchart, the steps in the algorithm are represented in the form of different shapes of boxes and the logical flow is indicated by interconnecting arrows. The boxes are used to represent different operations and the arrows are used to represent the sequence of these operations. Since this is a visual way of algorithm representation, it helps the programmer/tester in understanding the logic of the program.
Symbols used in the Flowcharts
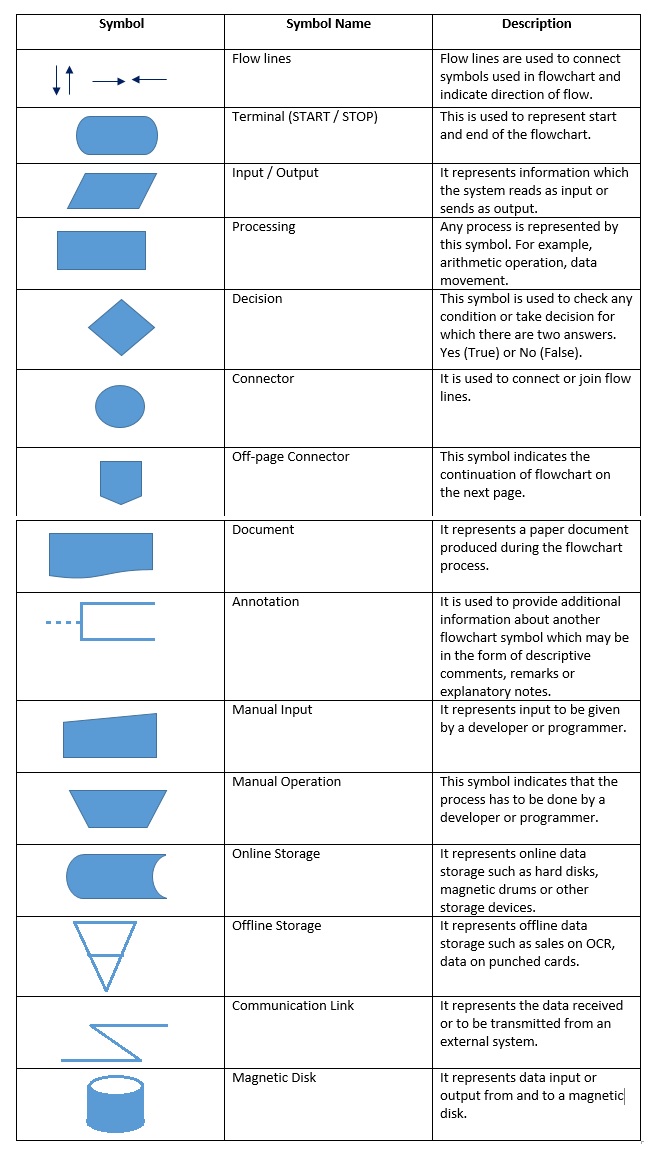
There are rules and standards for drawing flowcharts, prescribed by American National Standard Institute (ANSI). Table below shows some standard symbols which are frequently required in flowcharts.
Guidelines for preparing proper flowcharts
- The flowchart should be neat and easy to follow so that it will be clearly understood.
- A logical start and end must be given to the flowchart.
- The flowchart should include necessary steps in logical order.

- The only one flow line should come out from a process symbol.
- The decision making symbol should have only one incoming flow line. However, it may have two or three out-going flowlines.

- The terminal symbols, that is, Start and Stop / End symbols should have only one flow line.

- The symbol should contain the information (process, data or text) clearly to carry out the required action.
For example, to add two numbers A and B and storing results as C, draw the following block.

- The number of flow-lines can be reduced using connector symbol. The connectors are mainly required in complex flowcharts.
- The intersected flow-lines should be avoided. This makes the flowchart effective and represents communication clearly.
- The correctness of the flowchart can be tested by passing the test data through it. It becomes the validity test of the flowchart.
Benefits of Flowcharts
A flowchart is a step next to algorithm. The sequential steps in the algorithm are pictorially represented by the flowchart. This helps to clarify the actions to be taken. It also allows to improve the currently working things. The misplaced steps or unnecessarily included steps are clearly come into picture with the help of flowchart. The flowchart is a problem solving tool. The benefits of using it are discussed below.
- Logic understanding
Since the flow chart pictorially represents the actions to be performed, the logic used for solving the problem can be understood easily. The symbols used to perform various functions show the actions and their flow. Thus the actions with their sequence of execution can be cleared easily even to a non-expert or less experienced person with the help of flowchart. The fundamental control structures in computer programming can be visualized using flowcharts.
- Communication
The participants are communicated in process of flowchart development. Since the logic is pictorially represented, a common understanding about the process is established between them. It is a better way of communicating the logic of a system to all concerned. The flowchart makes the communication easier to all the involved people as compared to actual program code because all of them may not be aware of all the programming techniques and languages.
- Effective analysis
Actually, it is the duty of the programmer to analyze the problem. However, it can be handed over to other persons who may or may not be aware of the programming techniques. This becomes possible because of flowchart which gives broad idea about the logic. The testing and analysis of the logic is performed in an unbiased manner by these people. Thus the analysis of the problem becomes effective and easier because of flowchart.
- Useful in coding
When the flowchart becomes ready, the start and end are fixed along with all the necessary sequential steps. This flowchart acts as a guide to the programmer in planning the coding process effectively. Thus the flowcharts allow the programmer to develop error free programs in high-level languages at a faster rate.
- Proper testing and debugging
The errors in the program can be detected using flowchart. The logic used for solving the problem is exactly known to the developer. The developer can test a process by applying various data. This allows the testing of program in every contingency.
- Appropriate documentation
Most of the times the programs are developed for beginners. They can understand what the program actually does and how to use the program with the help of documentation. Flowcharts serve as good documentation tool for beginners.
Limitations of Flowcharts
The basic concept of the program can be understood by the flowchart. However, it cannot be used for programming. The programming should be done using language. Some of the limitations of the flowchart are discussed below.
- Complex
When a program is very large, the flowchart drawn for it needs many pages. It needs large efforts. The understanding of logic using such flowchart becomes difficult.
- Costly
If the problem-solving logic is straightforward and not very lengthy, flowcharts can be drawn easily and cost factor remains in proportion. However, if the application or the system is very large, the time taken for drawing flowcharts is very large and also the cost of factor goes out of proportion. That is, flowchart drawing process becomes costly.
- Difficult to modify
If any change in the symbol used in the flowchart or any modification to a flowchart is to be done, it is necessary to redraw the flowchart. This job becomes very tedious for a large or lengthy or complex flowcharts. Such flowcharts contain a large number of symbols, flow lines with proper spacing on a number of pages. So changing flowchart is not a simple task.
- No update
The user can easily understand the logic of the program using the flowchart. As per the requirements, the programs are updated regularly. However, the corresponding changes in the flowchart are not done, especially when the programs and hence the flowcharts are large or lengthy or complex. Because of this inconsistency in the flowchart, the user may not understand the logic used in the program. That is, the flowchart does not serve its basic purpose.
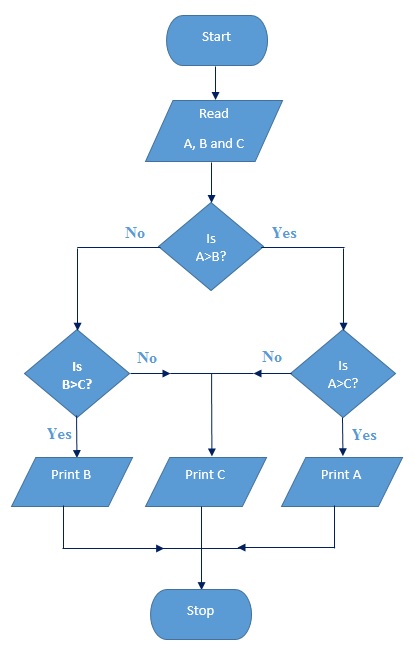
Basic flowchart example
To find and print the largest of the given three numbers A, B & C
Many free flowchart tools are available on the net https://www.draw.io/